Best Practices and Recommendations for New Salesforce Admins (Part Two - Reporting Recommendations)
They say hindsight is a wonderful thing and they are right, we can't go back and do over, but we can share what we have learnt and allow others to benefit from our experiences.
This was my approach to the session I presented at the Admin Theatre at this year's London World Tour. My talk was entitled Best Practices and Recommendations for New Salesforce Admins.
The role of Salesforce Admin brings with it a lot of responsibility, but thankfully also all the tools and support to enable each of us to be successful. When we start our Salesforce journey, however, we don't come with all this knowledge fully formed so here are my recommendations and tools to help everyone make the most of the available (#Safe Harbor) features.
For ease I am splitting my tips up into Best Practices, Recommendations, and Tools, and then into Setup, Reporting, and Productivity.
Part one here covers Setup Best Practices. This post (part two) covers Reporting Recommendations.
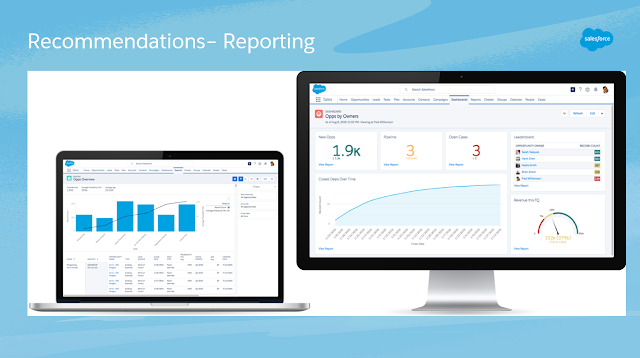
The Salesforce reporting tool can be powerful but out of the box it won't necessarily enable you to include all the data you wish to see together in one report. As with just about everything on this platform, the basics get us part way there but the joy is in the ease in which we can extend its functionality and customise it as we require. Custom Report Types are another example of that.
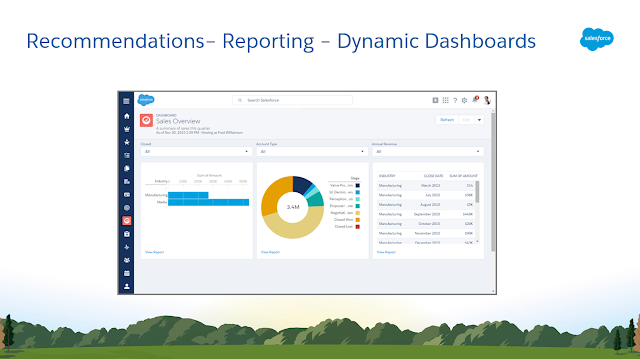
A similar trick is to use the filters on dashboards to reduce the number of dashboards you need to create for your users. Filters work exactly as you would expect, they allow your users to use a dashboard which shows them all types of sale (for example) but then filter the component, and therefore the underlying report, by certain values for a more drilled down view.
Think of the reporting and dashboards requests coming into your inbox, could you combine some of them into one task by using a filter? It is not just a time for us admins, but a much better UX for the user as they only have to go to one dashboard for both a top level, and detailed view.
That's it for part two.
Remember part one is here, part three is here, and part four here.
The Trailmix I created alongside this talk and blog series is here.
This was my approach to the session I presented at the Admin Theatre at this year's London World Tour. My talk was entitled Best Practices and Recommendations for New Salesforce Admins.
For ease I am splitting my tips up into Best Practices, Recommendations, and Tools, and then into Setup, Reporting, and Productivity.
Part one here covers Setup Best Practices. This post (part two) covers Reporting Recommendations.
The Salesforce reporting tool can be powerful but out of the box it won't necessarily enable you to include all the data you wish to see together in one report. As with just about everything on this platform, the basics get us part way there but the joy is in the ease in which we can extend its functionality and customise it as we require. Custom Report Types are another example of that.
In my experience there are four main use cases for Custom Report Types -
Custom Objects
When you create custom report types you have the option to tick the 'Allow Reports' checkbox, this will create a basic report type for you, in the same way as for standard objects out of the box. The object name in plural form will be immediately available, and if it is part of a master-detail relationship, or contains a lookup then reports will additionally automatically appear in the Other Reports folder for each relationship. If you do not choose to do this at the time of creation, then you can still create these reports, by building out a custom report type.
Making Fields From Related Standard or Custom Objects Available in One Report
If you have a requirement to include fields from multiple related objects in one report (and who doesn't?), then you will need to build a CRT to achieve this. When you create a new Custom Report Type you can select up to four levels of objects that are link through a parent-child relationship, however, you can use the Add related fields via lookup under Edit Layout to bring these fields into your field list palette.
In the past I have created a new CRT which sources only one object (standard or custom), for a particular recurring purpose and brought in those fields which relate to that purpose from many different objects (but available via a lookup relationship). I use this as a baseline report for any reporting of that type and direct my users to treat it as their go-to report type.
This means that if a user's requirements change and they ask for a particular field to appear in an existing report then I can add it in without issue, meaning that the user doesn't have to start their report from scratch, as they would do if they had selected a standard report type.
Happy User = Happy Admin.
With or Without
Another key feature of CRTs is that you can specify that the report, though relating two objects (in a parent-child relationship), doesn't require the results to have values in both tables. Consider the use case for this, I imagine they are plentiful.
Customisation
When you create your CRT you can customise it further by specifying which fields are checked by default, which order they appear in the field panel, and you can even rename them. This gives us Admins the ability to make the report writing process much clearer for our users, we can make sure that the fields they see make sense to them and appear in a logical order. It also enables you to ensure that you don't have two identically named fields causing possible confusion.
Considerations and Limits
You can add up to 1000 fields to each custom report type (a generous limit IMO).
CRTs can contain up to 60 object references, this counts the (up to) 4 main object relationships, and a further 56 via lookup.
That said, you can only include 20 different object columns.
Certain fields cannot be included, for example history fields and product schedules fields.
For full list of limits please see this link.
Another time saving recommendation is to create a standard 'default' dashboard for each key role such as Sales Executive, Sales Manager, Managing Director, and Marketing Manager but use the 'My' filters in each of your underlying reports. When you build out your dashboard select View Dashboard As - The dashboard viewer. This means that all your users can use the same dashboard, but you only have to build (and maintain) one!
Bear in mind that enterprise edition orgs only have 5 dynamic dashboards available, unlimited and performance 10, and there are only 3 available to play with in dev orgs. In addition you cannot schedule refreshes for dynamic dashboards, they must be refreshed manually.
A similar trick is to use the filters on dashboards to reduce the number of dashboards you need to create for your users. Filters work exactly as you would expect, they allow your users to use a dashboard which shows them all types of sale (for example) but then filter the component, and therefore the underlying report, by certain values for a more drilled down view.
Think of the reporting and dashboards requests coming into your inbox, could you combine some of them into one task by using a filter? It is not just a time for us admins, but a much better UX for the user as they only have to go to one dashboard for both a top level, and detailed view.
That's it for part two.
Remember part one is here, part three is here, and part four here.
The Trailmix I created alongside this talk and blog series is here.


Comments
Post a Comment